
How Video Data platform works?
This article dives into how Video Data platform functions in detail.
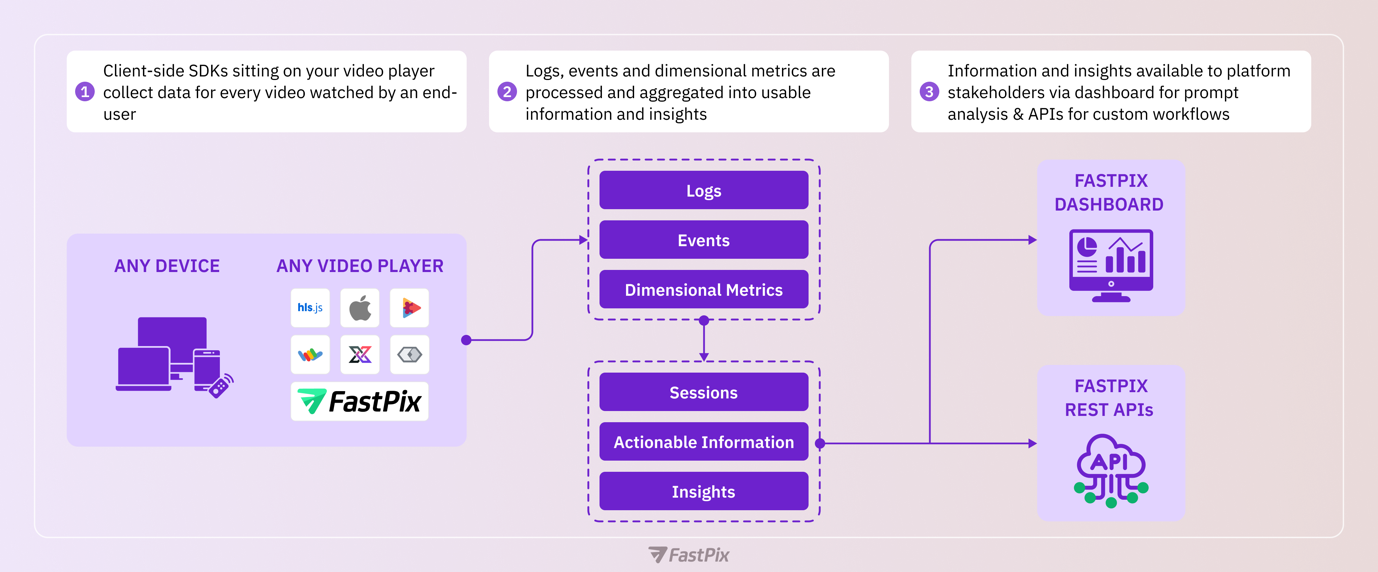
FastPix Video Data collects logs, events and dimensional metrics from video playback via light-weight client-side Data SDKs for popular video players spanning Web , Mobile and TV mediums. This encompasses every video watched by every end-user for any duration.
The logs, events and dimensional metrics are then processed and aggregated into usable information and insights that streaming platform operators can use to improve, fix and grow their products. Developers can use these insights to assess how changes to individual components affect the entire system. Architects can analyze historical data at a granular level without needing to reconstruct models from logs. Product managers can clearly observe QoE improvements from new investments or cost-saving infrastructure changes. In every case, understanding the connections between logs, events and dimensional metrics in relation to the services streaming platforms deliver will empower teams to make informed decisions.
Video Data can be consumed via our APIs and via our dashboard . The former to build custom workflows and the latter for immediate analysis.
1. Capturing raw data
It starts with an end-user watching your video.
When they do so, our video data SDKs capture logs, events and dimensional metrics. That’s everything you need to understand what happened technically and experientially.

What kind of data is captured? Here are all the things we capture, but they include:
Dimensional metrics:
- Device level data such as browser, browser version, OS, OS version, device name, device model, device type, device manufacturer
- Player level data such as player name, version, software name, software version
- Playback level data such as preload settings, autoplay, resolution, exits before video start among other things.
- Video level data such as media ID, source type, source stream type, DRM type etc.
- Network level data such as ASN, CDN etc.
- Geographical data such as continent, country, region/ state among other details.
- See more.
Events data:
- Startup metrics: video startup time, load time, latency, exits before video start, video startup failures
- Playback events: Play, pause, seek (fast forward/rewind), resolution variants, resolution changes
- Quality metrics: Buffer frequency, buffer counts, avg upscaling
- Viewer metadata: Device type, geography, session duration, content playing time
Logs, events and dimensional metrics are the raw building blocks that make Video Data work—they’re the most granular level of data we collect.
2. Process, aggregate, and calculations
Once we’ve captured all the data, the hard part of making them actionable, useful, and accessible begins. The purpose of this step is to help video platform stakeholders such as developers, architects, SREs and product managers understand what happens technically and experientially so they can make smarter decisions and faster improvements.
Some of the results of this processing, aggregation and calculations include:
Unified view
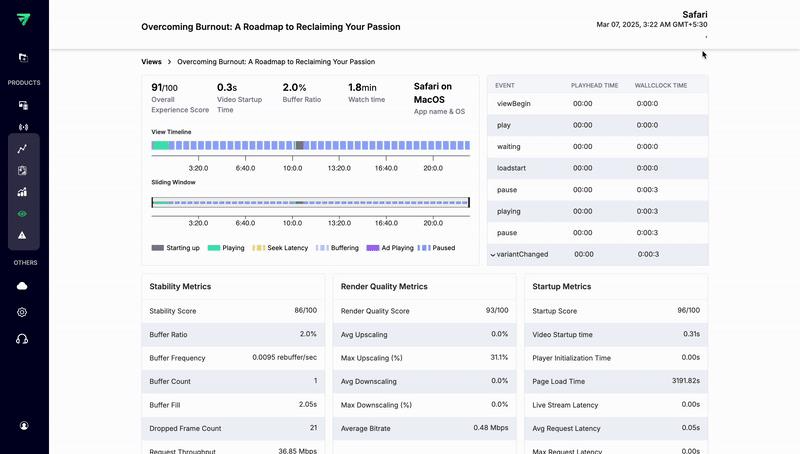
A unified view is a detailed session summary of everything that happened when an end-user watched your video. This encompasses a session lasting seconds to those lasting hours like a movie. This is valuable because if a user complains for any reason, and you need more details, these ‘views’ give you a complete technical, experiential and dimensional picture in one place. This way, you can debug issues, get detailed information about the user experience, and better support your users.
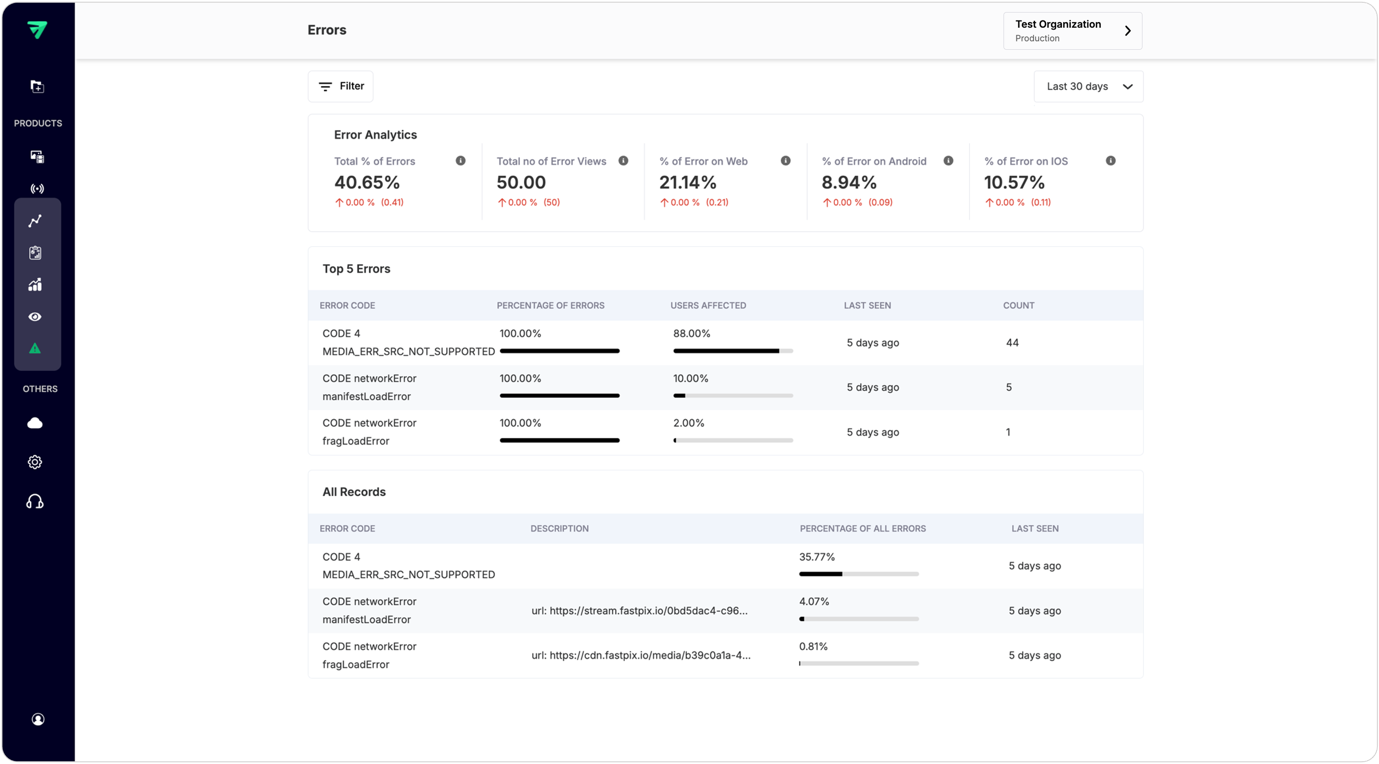
Errors logs
Let’s say you get an alert from Video Data about rebuffering or playback failures the viewer population are experiencing. You can immediately see all the information related to the error including type of error, reason for the error and type of videos, devices, geographies and the % of your end-users impacted. All this before support begins receiving complaints. This is what Video Data can help with, so you can jump on this and begin immediately to correct issues and do so precisely.
Scores
When you need to understand quality at a glance, scores are the shortcut.
FastPix Video Data tracks more than 30 underlying metrics—from buffering frequency and resolution drops to startup delays and playback exits. But parsing through raw metrics can take time. That’s why we aggregate them into weighted, composite scores that give you a clear, high-signal view of platform performance across categories like playback quality, stability, startup experience, and engagement.
Each score combines several related metrics into a single, interpretable value. For example:
- Startup Score includes video startup time, player load time, and exits before playback begins.
- Stability Score reflects buffering frequency, stall duration, and rebuffering ratios.
- Render Quality Score captures resolution switches, average bitrate, downscaling, and upscaling levels.
- QoE Score is a roll-up score that blends stability, startup, and render quality to represent overall experience.
- Engagement metrics, like average watch time and peak engagement periods, are also tracked alongside these scores to complete the picture.
These scores are visible in the Metrics dashboard, where each workspace gets a detailed, sliceable view. You can break them down by geography, device type, video ID, app version, or custom dimensions.
3.1 Dashboards for prompt analysis
Once you have finished installing suitable video SDKs, Video Data’s pre-built dashboards leverage our APIs to give you all the information, insights and tools you need to deliver great video experiences immediately.
Upon accessing the dashboard, briefly, here are the sections you will find and their purpose:
1.Views section:
- List of individual view sessions.
- Open any ‘view’ and dive into granular details. You can customize these views with your customer IDs, customer cohorts, marketing campaigns etc. using our custom dimensions . This can be super helpful in situations such as a customer calling customer support to complain; then you diagnose the specific customer’s session rather turning to aggregated metrics that may mask a problem at the system level.
- Filter views by different time frames
2.Metrics tool:
- Essentially a multi-dimensional filtering tool that allows you to filter data based on various criteria. For instance, how many users in US & Canada use android X devices, during this new release how many folks watched via Android devices vs. apple devices and so on for forth.
- Aggregated metrics for various time frames presented as graphs for easy assessment (e.g., buffering rates decreasing month-over-month).
3.Errors section:
- Detailed analytics on top errors affecting playback.
- Insights into root causes (e.g., network issues vs. player bugs).
4.Overview page:
A quick dashboard for various filter-able timeframes that help you promptly assess:
- How many people are watching on my platform?
- Which content is most popular?
- What time do viewers engage with my platform the most?
- Engagement heatmaps showing peak usage times?
- Where does my content perform best geographically?
- Which resolution provides the smoothest experience?
- Which content faces the most issues (e.g., buffering or errors)?
For more details on using our dashboard, please read our compete guide to understanding our dashboards . You can also chat with us about any questions, and we can expand or clarify further.
3.2 Restful APIs to build custom workflows
While our built-in dashboards provide valuable insights out of the box, developers also have the flexibility to create their own custom dashboards using our APIs. By so doing, you can tailor the visualizations, metrics, and trigger other actions to fit your specific needs and goals.
Please refer to our API reference or Templates for a detailed overview. A quick summary of our API endpoints is as follows:
How to fetch granular data?
- List video views : Retrieve a list of individual video views (raw data).
Use case: Get all views in a timeframe to analyze session-level details. - Get video view details : Drill into a specific view’s metadata (e.g., quality scores, errors).
Use case: Debug why a specific viewer experienced buffering.
How to aggregate for trends and analysis?
- List by top content : Identify top-performing videos.
Use case: Find which content drives the most engagement. - List overall values : Fetch aggregated metrics (e.g., total views, avg. watch time).
Use case: Measure your platform-wide performance.
How to segment & compare different data?
- List dimensions : Get all available segmentation options (e.g., country, device).
- List filter values for a dimension : Filter data or a metric by specific criteria (e.g., "device=mobile").
- List breakdown values : Get all data for a metric grouped by segments. (e.g., Watch time by country).
How to analyze trends over time?
- Get timeseries data : Track metrics over time (e.g., daily views).
Use case: Identify peak engagement hours.
How to diagnose playback issues?
- List errors : List common errors (e.g., buffering, playback failures).
- List comparison values : Compare error rates across segments (e.g., "Error A vs. Error B").