
How Video Data works
FastPix Video Data provides robust analytics for video content, enabling you to monitor and optimize viewer engagement, experience quality, and technical performance.
Video analytics give you the visibility into how viewers interact with your content and the quality of their experience. You can identify engagement patterns, diagnose playback issues, and make data-driven decisions to improve content delivery. By monitoring key metrics in real-time, you can quickly identify and resolve issues before they impact your audience at scale.
How the platform works
FastPix Video Data collects playback events as and when they happen from video playback by using our easy to integrate Data SDKs for popular players in Web, Android and iOS Platforms. It provides insights for viewer engagement and QoE analysis by getting deeper into important metrics such as Audience Metrics, Play Metrics, Failure Metrics, Stream Metadata and Custom metadata by filtering data across 50+ dimensions and different timeframes.
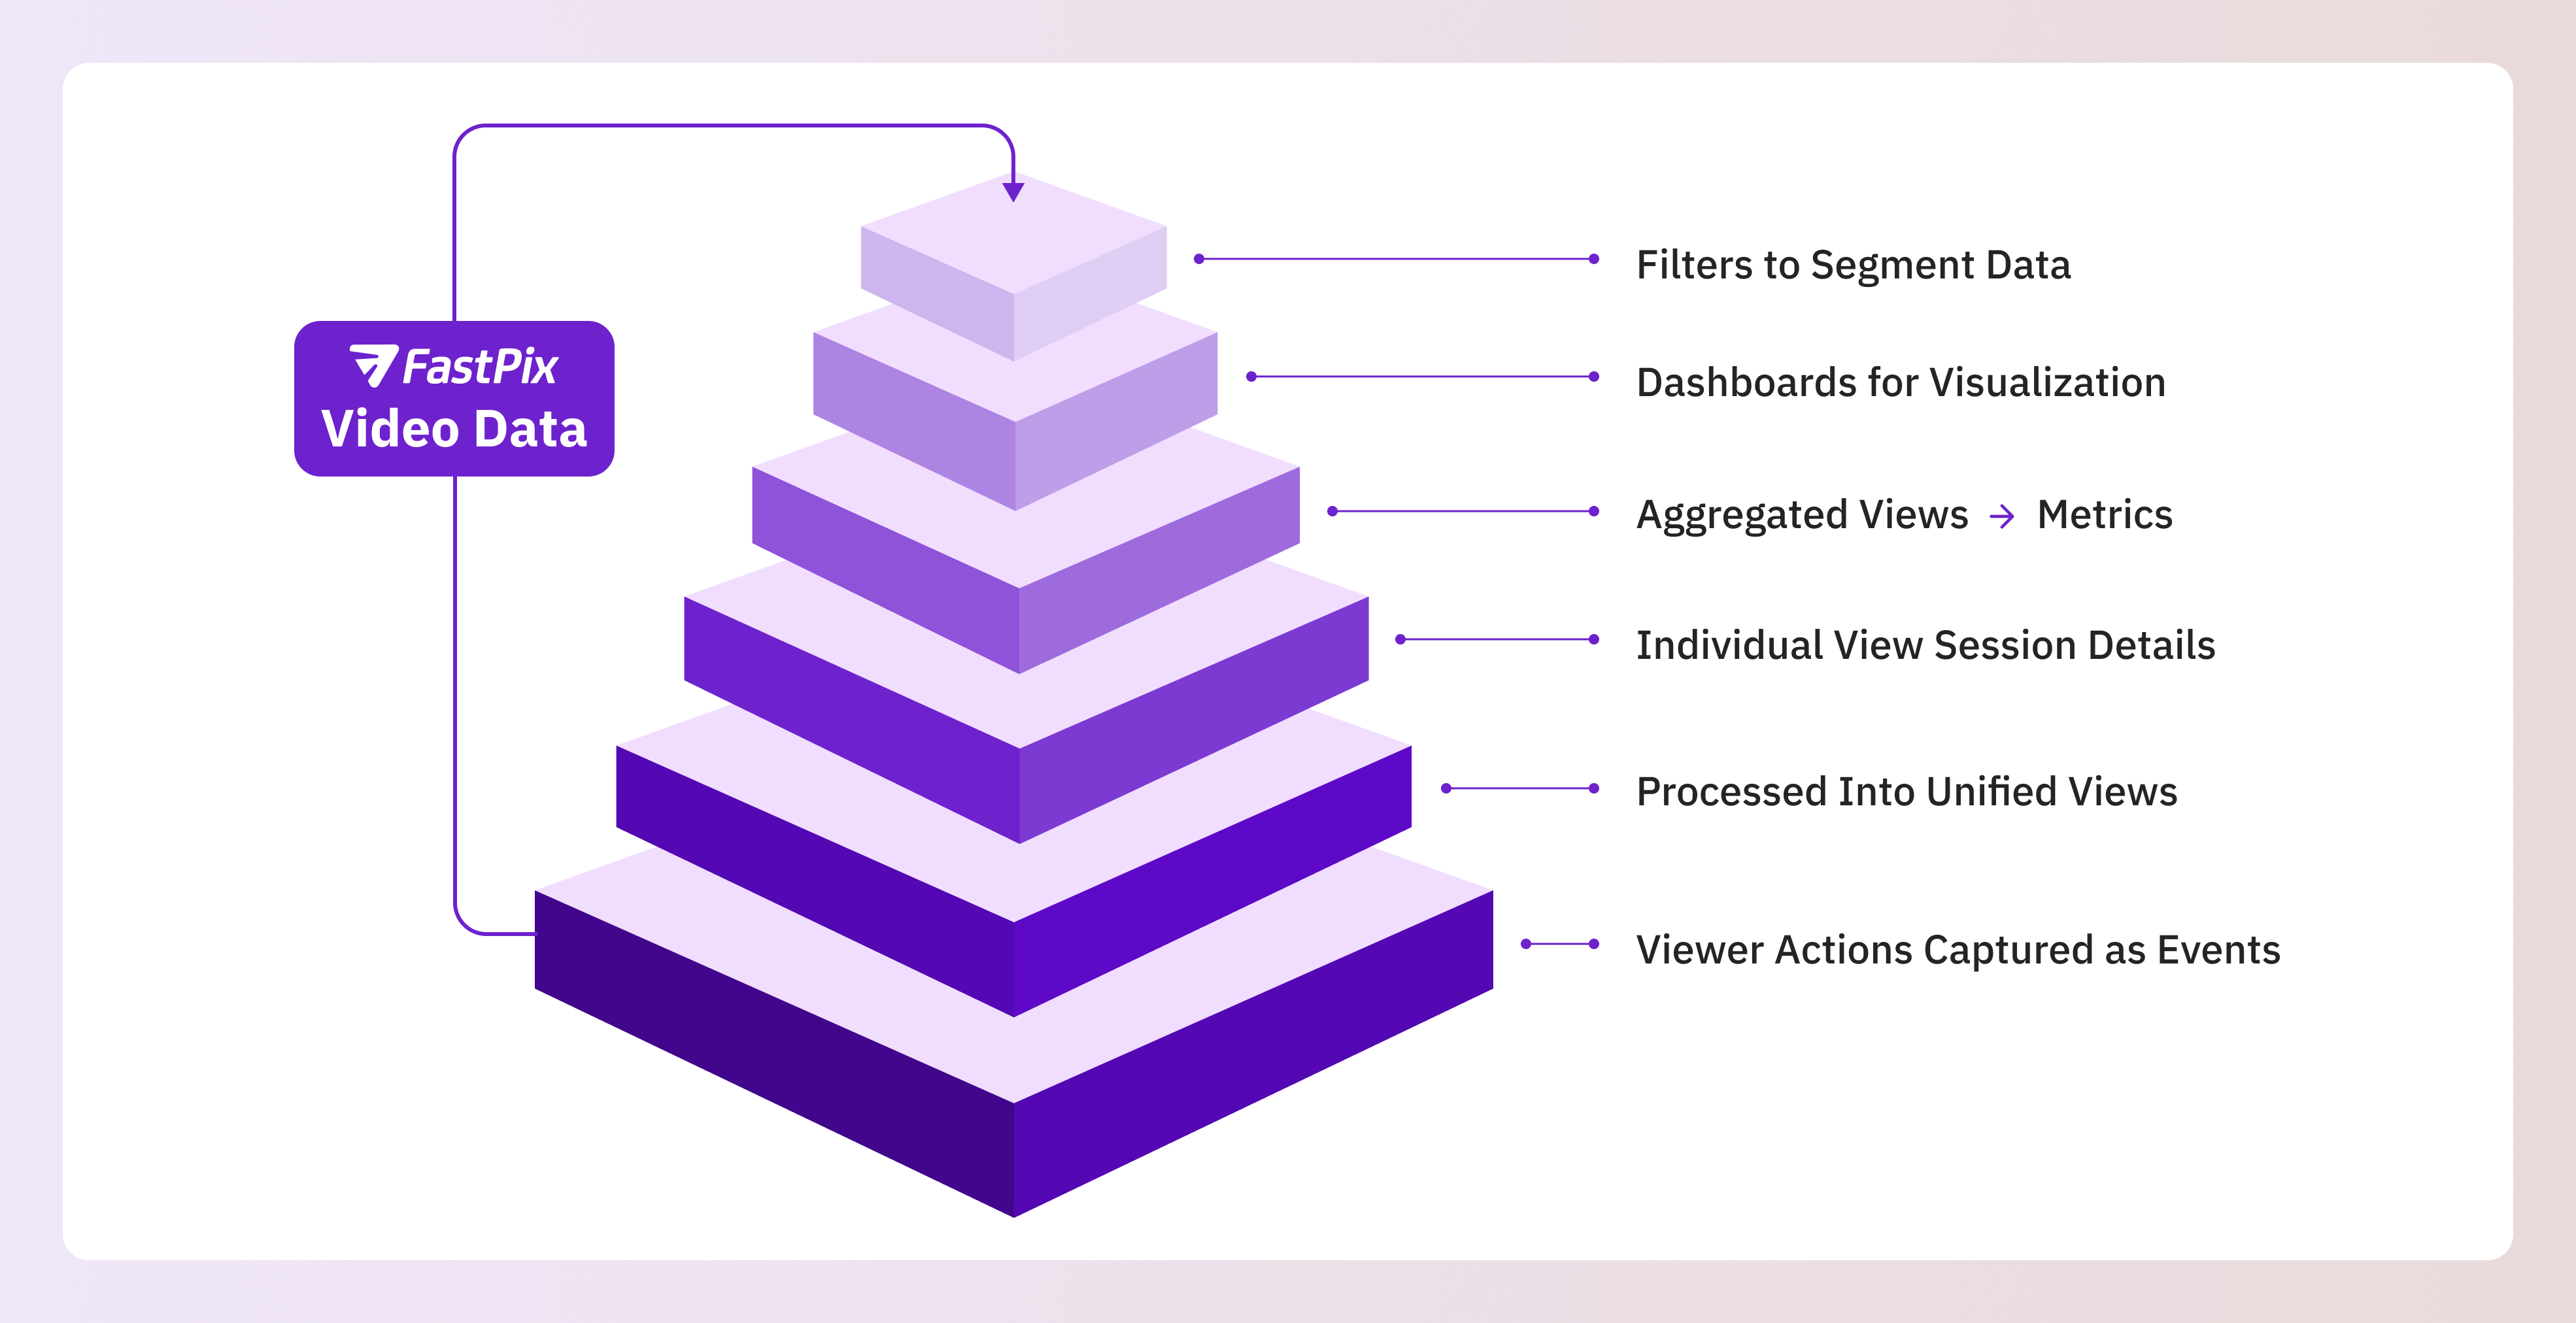
To understand all the above and how Video Data works as a platform, we think going step by step, through a bottom-up approach is the easiest way around. By the end of this, you’ll understand how every layer of data works together to provide the insights for your dashboards and reports.
The big picture
Our product is built from the ground up to ensure every layer—from raw events to dashboards—is connected seamlessly. By starting at the bottom with granular views and building upward through aggregations and metrics, we ensure that every insight you see is backed by detailed data.
This approach ensures that:
- You can trust the insights presented in dashboards because they’re rooted in raw data.
- You have flexibility to drill down into granular details when needed.
- You get answers to both micro-level questions (individual session performance) and macro-level questions (platform-wide trends).
Bottom-up approach diagram:
Here’s how everything connects in our product.
Why this bottom-up approach matters
- Granularity first: It all starts with capturing granular data (events). Without this foundation, higher-level insights wouldn’t be possible.
- Unified views: Each video playback is collected as a view session and listed out.
- Individual view sessions: Allows you to deep dive into specific sessions when needed. Providing detailed information for each session—giving you clarity about individual experiences.
- Aggregations: Helps you identify patterns across sessions and answer broader questions about platform performance.
- Metrics: Summarize key aspects of engagement, quality, and errors—making it easier to measure success.
- Dashboards: Present all this data visually so you can make informed decisions quickly.
- Filtering: Enhances analysis by allowing segmentation based on various criteria.
1. Starting at the bottom: Capturing viewer actions
Whenever someone watches a video on your platform, every action they take is captured as events using our data SDKs. These events are like tiny pieces of information that record what happened during the viewing session.
What kind of actions are captured?
- Playback events: Play, pause, seek (fast forward/rewind)
- Quality metrics: Buffering, resolution changes
- Network details: Connection type (Wi-Fi or mobile), ISP (ASN)
- Viewer metadata: Device type, geography, session duration
You can think of these events as the raw building blocks that makes Video Data work—they’re the most granular level of data we collect.
2. Processing events into unified views
Once we’ve captured all these events, we process them using our business logic to create something called a unified view. A unified view is like a detailed summary of everything that happened during a single viewing session.
What does a unified view include?
A unified view contains:
- Quality scores: Startup score, stability score, playback score—all calculated based on the viewer’s experience.
- Video metadata: Information like video ID, title, and category.
- Network details: ISP (ASN), connection type (Wi-Fi/mobile).
- Player details: Device type and player version.
- Geography details: Country and region.
- Custom data: Any additional information relevant to your business needs.
Why unified views are important:
A single view gives you complete information about how a viewer felt during their session. It’s like having a full report card for every individual viewing experience.
3. Individual view session details
In addition to aggregated data, we also provide a section where you can view individual views on Dashboard within a selected time frame. This feature allows you to list all the views recorded during that period.
How it works:
- Select your desired time frame (e.g., last week, last month).
- Access a list of individual views captured during that time.
- Upon selecting a specific view from the list, you’ll see detailed information about that session—everything from quality scores to network details.
Why this matters:
Being able to drill down into individual views helps you troubleshoot specific issues or understand unique viewer experiences in greater detail.
4. Aggregating views for platform insights
While a single view tells us about one viewer’s experience, aggregating multiple views helps us understand patterns at the platform level. This is where things get exciting—we use these aggregated views to answer big questions about your platform’s performance.
Questions we can answer through aggregations:
- How many people are interested in my platform?
- Which content is most popular?
- What time do viewers engage with my platform the most?
- Where does my content perform best geographically?
- Which resolution provides the smoothest experience?
- Which content faces the most issues (e.g., buffering or errors)?
Aggregations allow us to zoom out and see trends across all viewers instead of focusing on individual sessions.
5. Metrics to measure performance across categories
To help answer these questions, we calculate various metrics based on aggregated views. Metrics are numbers that summarize key aspects of performance across categories like engagement, video quality, and errors.
Examples of metrics we track:
- Engagement metrics:
- Average watch time
- Peak engagement times
- Quality metrics:
- Buffering rate (% sessions with buffering)
- Resolution trends (e.g., 1080p vs. 720p usage)
- Error metrics:
- Top error codes
- Error rates by device or region
We track around 30 metrics covering buffering, startup performance, video quality, and engagement to give you a comprehensive view of your platform’s health. Here’s a list of all the aggregations that we are tracking.
| Metric | Measurements Used for Metric Calculations |
|---|---|
| views | count |
| unique_viewers | count |
| playing_time | sum, median, avg |
| quality_of_experience_score | avg |
| playback_score | avg |
| playback_failure_percentage | avg |
| exit_before_video_start | avg |
| video_startup_failure_percentage | avg |
| startup_score | avg |
| video_startup_time | median, 95th percentile |
| player_startup_time | median, 95th percentile |
| page_load_time | median, 95th percentile |
| total_startup_time | median, 95th percentile |
| live_stream_latency | median, 95th percentile |
| average_bitrate | median, 95th percentile |
| buffer_count | median, 95th percentile |
| render_quality_score | avg |
| avg_upscaling | avg, 95th percentile, median |
| avg_downscaling | avg, 95th percentile, median |
| max_upscaling | avg, 95th percentile, median |
| max_downscaling | avg, 95th percentile, median |
| jump_latency | avg |
| stability_score | avg |
| buffer_ratio | avg |
| buffer_frequency | avg |
| buffer_fill | median, 95th percentile |
6. Built-in dashboards and customization options
We have developed built-in dashboards that leverage our APIs to expose information from individual views and metrics. These dashboards allow you to easily visualize key insights and track performance metrics without any additional setup.
All this data—views, aggregations, and metrics—is presented in a way that helps you make informed decisions about your content and platform performance.
What you’ll see in our dashboards:
- Metrics section:
- Graphs showing trends over time (e.g., buffering rates decreasing month-over-month).
- KPIs highlighting key performance indicators.
- Errors section:
- Detailed analytics on top errors affecting playback.
- Insights into root causes (e.g., network issues vs. player bugs).
- Overview page:
- Engagement heatmaps showing peak usage times.
- Geographic performance comparisons across regions.
- Views section:
- List of individual view sessions.
- Drill down into the view session details and events.
Dashboards make it simple to visualize complex data and translate it into actionable insights.
Customization options:
While our built-in dashboards provide valuable insights out of the box, users also have the flexibility to create their own custom dashboards using our APIs. By doing so, you can tailor the visualizations and metrics to fit your specific needs and preferences.
Understanding data layout for custom dashboards:
To effectively build your own custom dashboard:
- Familiarize yourself with how data is structured in our APIs.
- Understand the relationships between different data points (e.g., how views relate to metrics, how dimensions relate to metrics and views).
This foundational knowledge will make it easier for you to extract relevant information and create meaningful visualizations tailored to your objectives.
7. Advanced filters to segment data
To further enhance your analysis, we offer a robust filtering section that is common across all areas mentioned earlier—metrics, individual views, and dashboards.
How filtering works:
- You can segment data based on various criteria such as:
- Country (e.g., filter metrics for viewers from the US)
- Device type (e.g., mobile vs. desktop)
- Time periods (e.g., last week vs. last month)
- Applying filters allows you to visualize metrics more effectively by honing in on specific segments that matter most to your analysis.
Why filtering matters:
Filtering enables you to customize your insights according to your needs and focus on specific audiences or trends that are relevant to your business goals.
Updated 1 day ago