
Troubleshoot errors
Learn how FastPix analyzes video playback errors, startup failures, and platform performance issues.
For video platforms, performance is crucial for user retention and maintaining a positive brand image. Playback errors, which occur due to various factors such as poor internet connections, outdated device drivers, incompatible codecs, browser issues, hardware limitations, streaming server problems, and video player issues, significantly impact user experience. This guide focuses on understanding and managing playback errors to enhance streaming performance.
Understanding playback errors
Playback errors can be categorized into two primary types:
- Video startup errors: These occur when a video fails to start playing due to issues like server overload, network congestion, or incompatible video formats.
- Playback failure errors: These happen when a video stops playing mid-stream, often caused by factors such as buffering, internet connectivity issues, or hardware limitations.
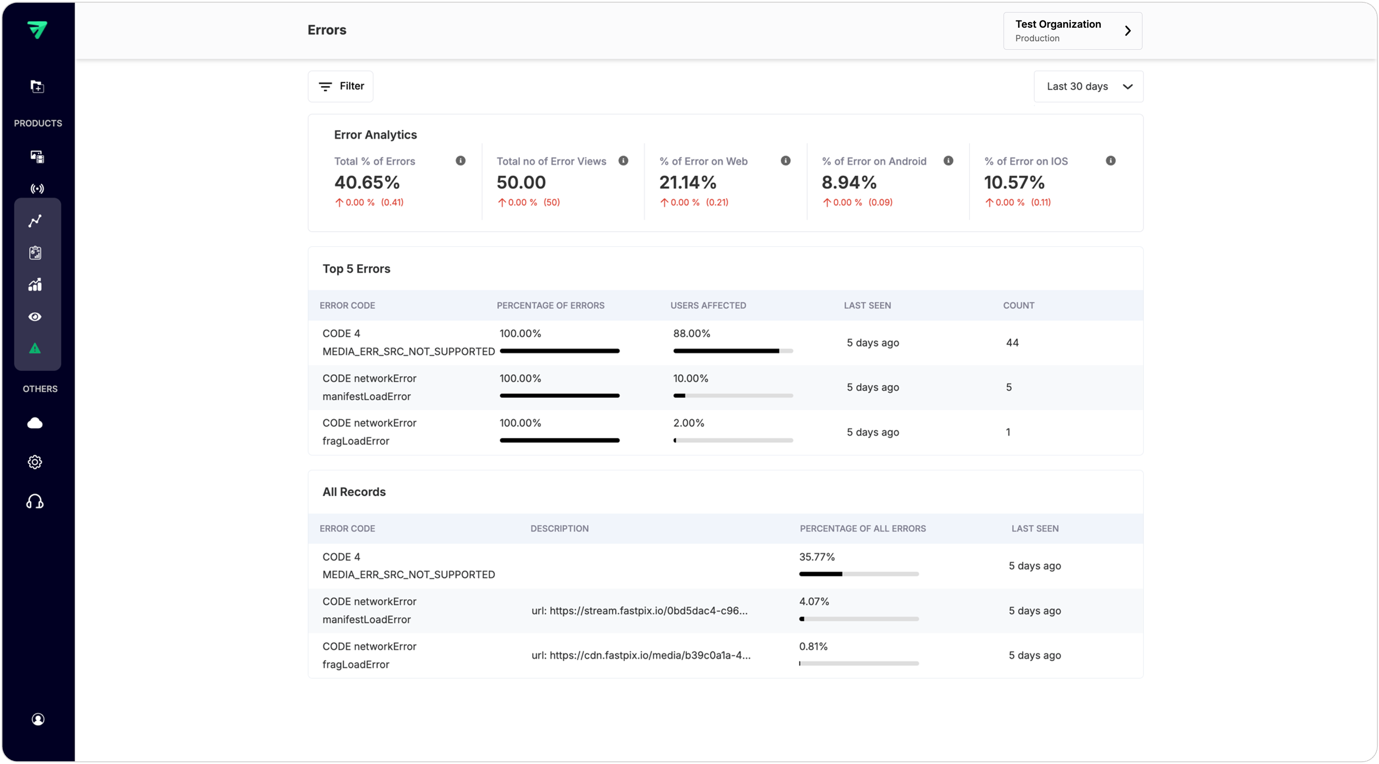
Measuring playback errors
To get insights into the types of errors occurring and their impact on different platforms or video types, it's essential to measure these errors platform-wise. At FastPix, error analytics focus on the Playback Failure Percentage Error, which calculates the percentage of error views out of all views within a specified timeframe or filters.
Key metrics for error analytics
- Platform-wide error percentage: This metric provides an overview of error rates across different platforms such as web, Android, and iOS.
- Total error views: The total number of views that encountered errors.
- Top 5 errors: Identifying the most common errors helps prioritize fixes.
- Number of users affected per error: Understanding how many users are impacted by each error type aids in resource allocation for fixes.
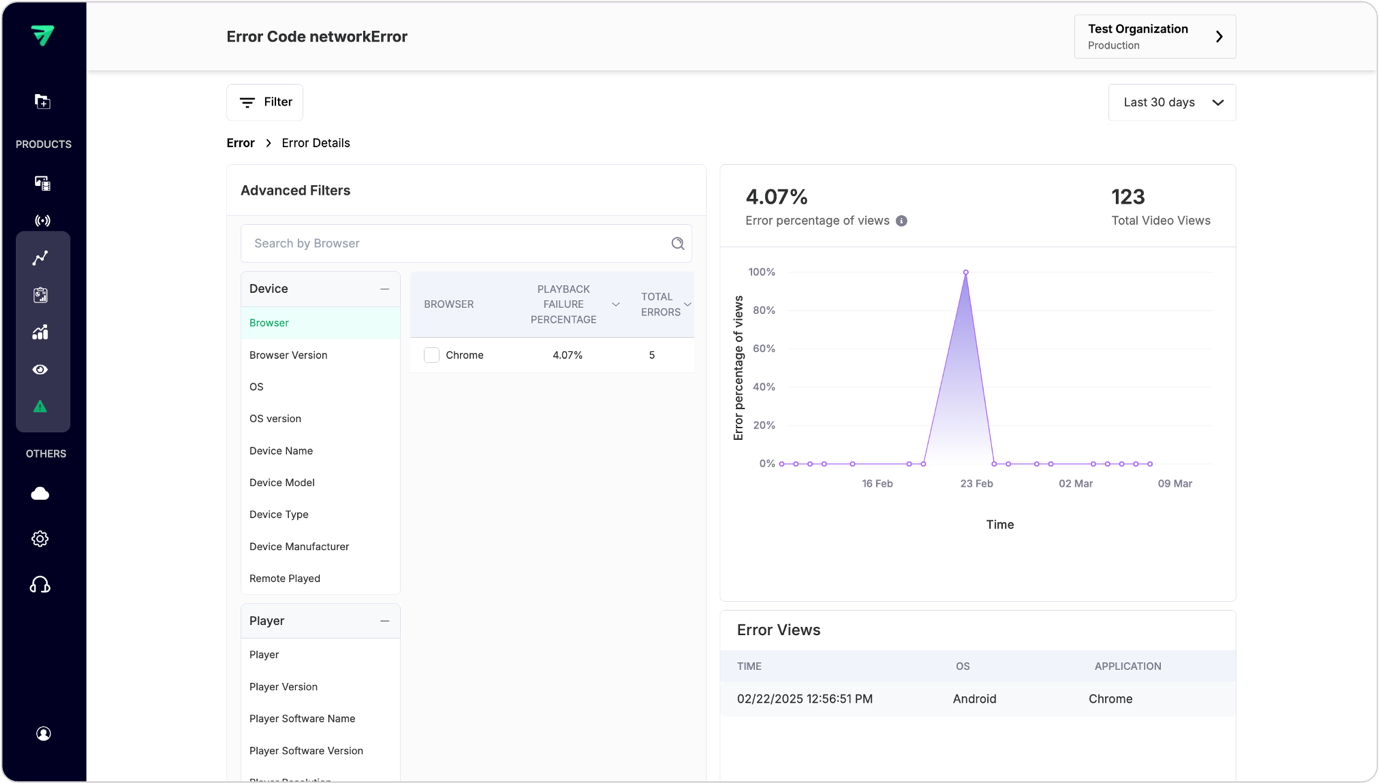
View error details
You can navigate to error details by clicking on error record from All Records section. The navigation of this page is similar to the Metrics Page.
For instance, in the reference below a network error happened specific to a Chrome browser running on an Android OS with a 4.07% of total viewers who got affected with the error.
Taking error analysis one step further
To further analyze errors, it's beneficial to:
- Compare error rates over time: Using time-series graphs to track changes in error rates across different dimensions (e.g., platforms, video types) helps identify trends and patterns.
- Analyze error types: Breaking down errors by type (e.g., startup vs. playback failure) allows for targeted improvements.
Using APIs to get errors
The List Errors endpoint gives you the total number of playback errors that occurred, along with the total number of views captured, based on the specified timespan and filters. It provides insights into the overall playback quality and helps identify potential issues that may impact viewer experience.
curl --request GET \
     --url 'https://api.fastpix.io/v1/data/errors?limit=1' \
     --header 'accept: application/json'
     --user '{Access_Token}:{Secret_Key}'
Here’s how you get the response:
{
  "success": true,
  "data": {
    "errors": [
      {
        "percentage": 0.022222222222222223,
        "notes": "An informative note on specific error",
        "message": "com.fastpix.stats.sdk.h71.a - android.media.mediadrm$mediadrmstateexception: failed to handle key response: drm vendor-defined error: -2998",
        "lastSeen": "2023-12-01T11:31:07Z",
        "id": "9pa85f64-5717-4562-b3fc-2c963f66afa6",
        "description": "a description for the specific error",
        "count": 4,
        "code": 1003
      }
    ],
    "topErrors": [
      {
        "percentage": 0.022222222222222223,
        "uniqueViewersEffectedPercentage": 0.012222222222222223,
        "notes": "An informative note for a specific error",
        "message": "com.fastpix.stats.sdk.h71.a - android.media.mediadrm$mediadrmstateexception: failed to handle key response: drm vendor-defined error: -2998",
        "lastSeen": "2023-12-01T11:31:07Z",
        "id": "9pa85f64-5717-4562-b3fc-2c963f66afa6",
        "description": "a description of the specific error",
        "count": 4,
        "code": 1003
      }
    ]
  },
  "timespan": [
    1610025789,
    1610025947
  ]
}
Updated 7 months ago