
Understand data definitions
Learn about metrics such as video views, playback quality, and engagement to assess performance and audience behavior.
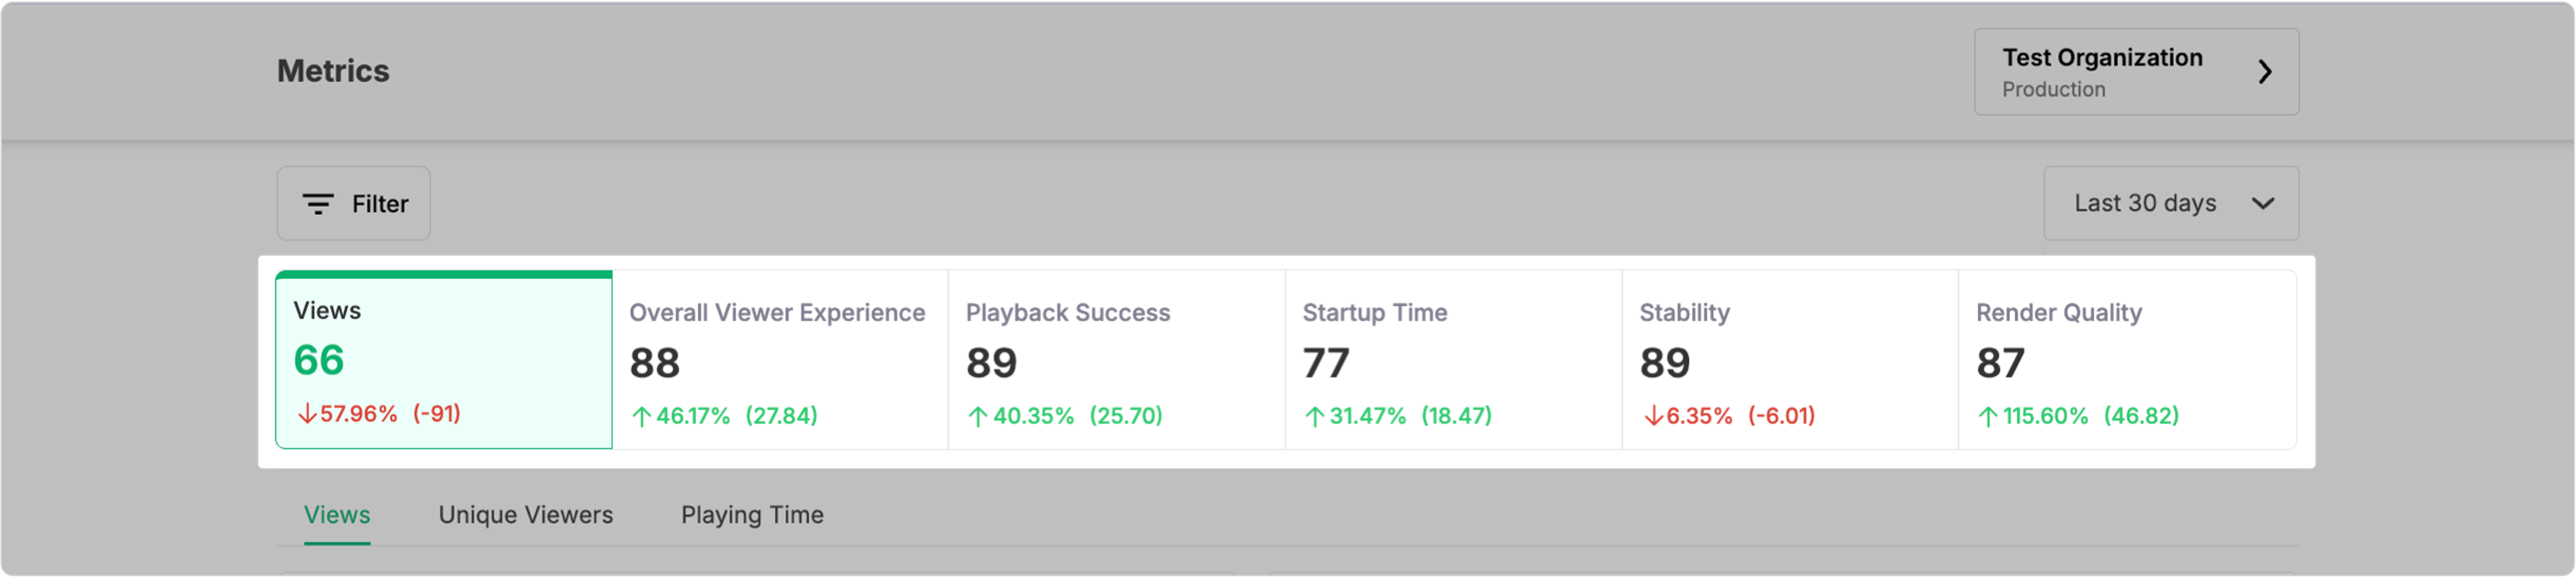
This guide will help explore the six key metric groups we have defined to assess viewer engagement and QoE, helping you optimize content delivery and improve user satisfaction.
Understanding views in video metrics
A "view" is defined as any attempt to play a video, regardless of whether the playback is successful. This includes instances where a viewer clicks the play button or when playback is initiated programmatically.
How views are counted:
-
Initiation of playback: A view is recorded as soon as a viewer attempts to start the video. This means that even if playback fails (for example, due to buffering issues or network interruption), it still counts as one view.
-
Session duration: Each view remains active until the video playback is either completed or interrupted—such as when the viewer navigates away from the page. Additionally, if playback stops but the viewer does not explicitly end it, the view will be counted for up to one hour.
-
Continuous viewing: If a viewer pauses and then resumes watching the same video, it is still counted as a single view. Similarly, if a video is looped or replayed during a single session, it will not increase the view count.
Implications for data collection
When analyzing metrics based on views, it's essential to recognize that our measurements are derived from data collected during each unique viewing session. Therefore, if you notice an unexpectedly high number of views in your dashboard, it may be beneficial to review the implementation of your data tracking code to ensure that it initializes correctly for each playback attempt.
| Category | Metric | Definition |
|---|---|---|
| Audience Metrics | Views | Total number of times the video has been viewed. |
| Unique Visitors | The number of distinct users who have viewed the video. | |
| Playing Time | Total time spent by viewers watching the video. | |
| QoE Metrics | Overall Experience Score | A composite score reflecting the overall viewer satisfaction with the video playback experience. |
| Playback Metrics | Playback Success Score | The percentage of successful playback instances compared to total playback attempts. |
| Playback Failure Percentage | The percentage of playback attempts that resulted in failure. | |
| Exits Before Video Start | The number of viewers who exited before the video started playing. | |
| Video Startup Failure Percentage | The percentage of times the video failed to start after being requested. | |
| Startup Metrics | Startup Time Score | A score quantifying viewer satisfaction based on how quickly the video starts playing after being requested. |
| Video Startup Time | The time taken for the video to begin playback after initiation, measured in seconds. | |
| Player Initialization Time | The duration it takes for the player to initialize and be ready for playback commands after page load. | |
| Page Load Time | The time taken for the page containing the video to load fully before playback begins. | |
| Total Startup Time | The cumulative time from initiating playback until the video is ready to watch, including all delays. | |
| Jump Latency | The average duration viewers wait for a video to resume after jumping to a new timestamp within the content. | |
| Stability Metrics | Stability Score | A score reflecting the level of interruptions during video playback; higher scores indicate fewer disruptions. |
| Buffer Ratio | The percentage of total viewing time spent buffering; lower ratios indicate a smoother viewing experience. | |
| Buffer Frequency | The frequency of rebuffering events during playback, measured in events per second; higher frequencies can indicate playback issues. | |
| Buffer Fill | The average duration (in seconds) that viewers experience rebuffering per video view. | |
| Buffer Count | The total number of times buffering occurred during a video view; frequent buffering can negatively impact viewer satisfaction. | |
| Render Quality Metrics | Render Quality Score | A score quantifying perceived visual quality based on the percentage of views rated at the highest quality level (100). Higher scores indicate better visual quality. |
| Upscale Percentage | The average percentage of time that the video player upscales the resolution during playback; frequent upscaling may affect perceived quality. | |
| Downscale Percentage | The average percentage of time that the video player downscales the resolution during playback; this can indicate how well content matches viewer device capabilities. | |
| Max Upscaling | The maximum percentage to which the video player upscales the video resolution to match the device's screen resolution. | |
| Max Downscaling | The maximum percentage to which the video player downscales the video resolution to fit the screen. | |
| Average Bitrate | The average number of bits per second delivered in the video stream, indicating data consumption and potential quality levels. | |
| Live Stream Latency | The delay between real-time events and their display on viewers' screens during live streaming sessions; lower latency is preferable for real-time engagement. |
Using APIs to retrieve metrics
To get audience metrics like Views across different timeframes and filter options, you can use the FastPix API endpoints. Below is a step-by-step guide to walk you through retrieving these metrics.
Step 1: Set up your API access
Before making requests to the FastPix API, ensure you have your Access Token ID and Secret Key ready for authentication. See the Basic Authentication Guide for details on retrieving these credentials.
Step 2: Retrieve overall values for views
To get the views metric across different timeframes, you can use the list overall values endpoint. Here’s how to make a request:
curl --request GET \
     --url 'https://api.fastpix.io/v1/data/metrics/views/overall?timespan[]=30:days' \
     --header 'accept: application/json' \
     --user '{Access_Token}:{Secret_Key}
In the above request, you need to replace Access Token ID and Secret Key with your actual credentials. Also, adjust the timespan parameter as needed (Example: 7:days, 30:days, etc.).
{
  "success": true,
  "metadata": {
    "aggregation": "view_end"
  },
  "data": {
    "value": 118,
    "totalWatchTime": 2643439,
    "totalViews": 118,
    "totalPlayTime": 1722574,
    "uniqueViews": 15,
    "globalValue": 0.5107432787924294
  },
  "timespan": [
    1735117394,
    1737709394
  ]
}
Please refer our API reference for overall values to understand more about different parameters that you can apply to get the values for all other metrics.
Similarly, in order to visualize the value of a metric and number of views within a timeframe, you can use Get timeseries data endpoint . The response includes an array of data points, each representing the metric's value and view count at specific intervals. This can be used to create graphical representations.
Also, to understand how views are split across different dimensions like browser, device type, you can use List breakdown values . For instance, if you want to analyze how watch time varies across different device types. By calling this endpoint for the playing_time metric and filtering by device_type you can understand how engagement differs between mobile, desktop, and tablet users. This data will guide optimization efforts for different platforms.
Updated 7 months ago